Charts
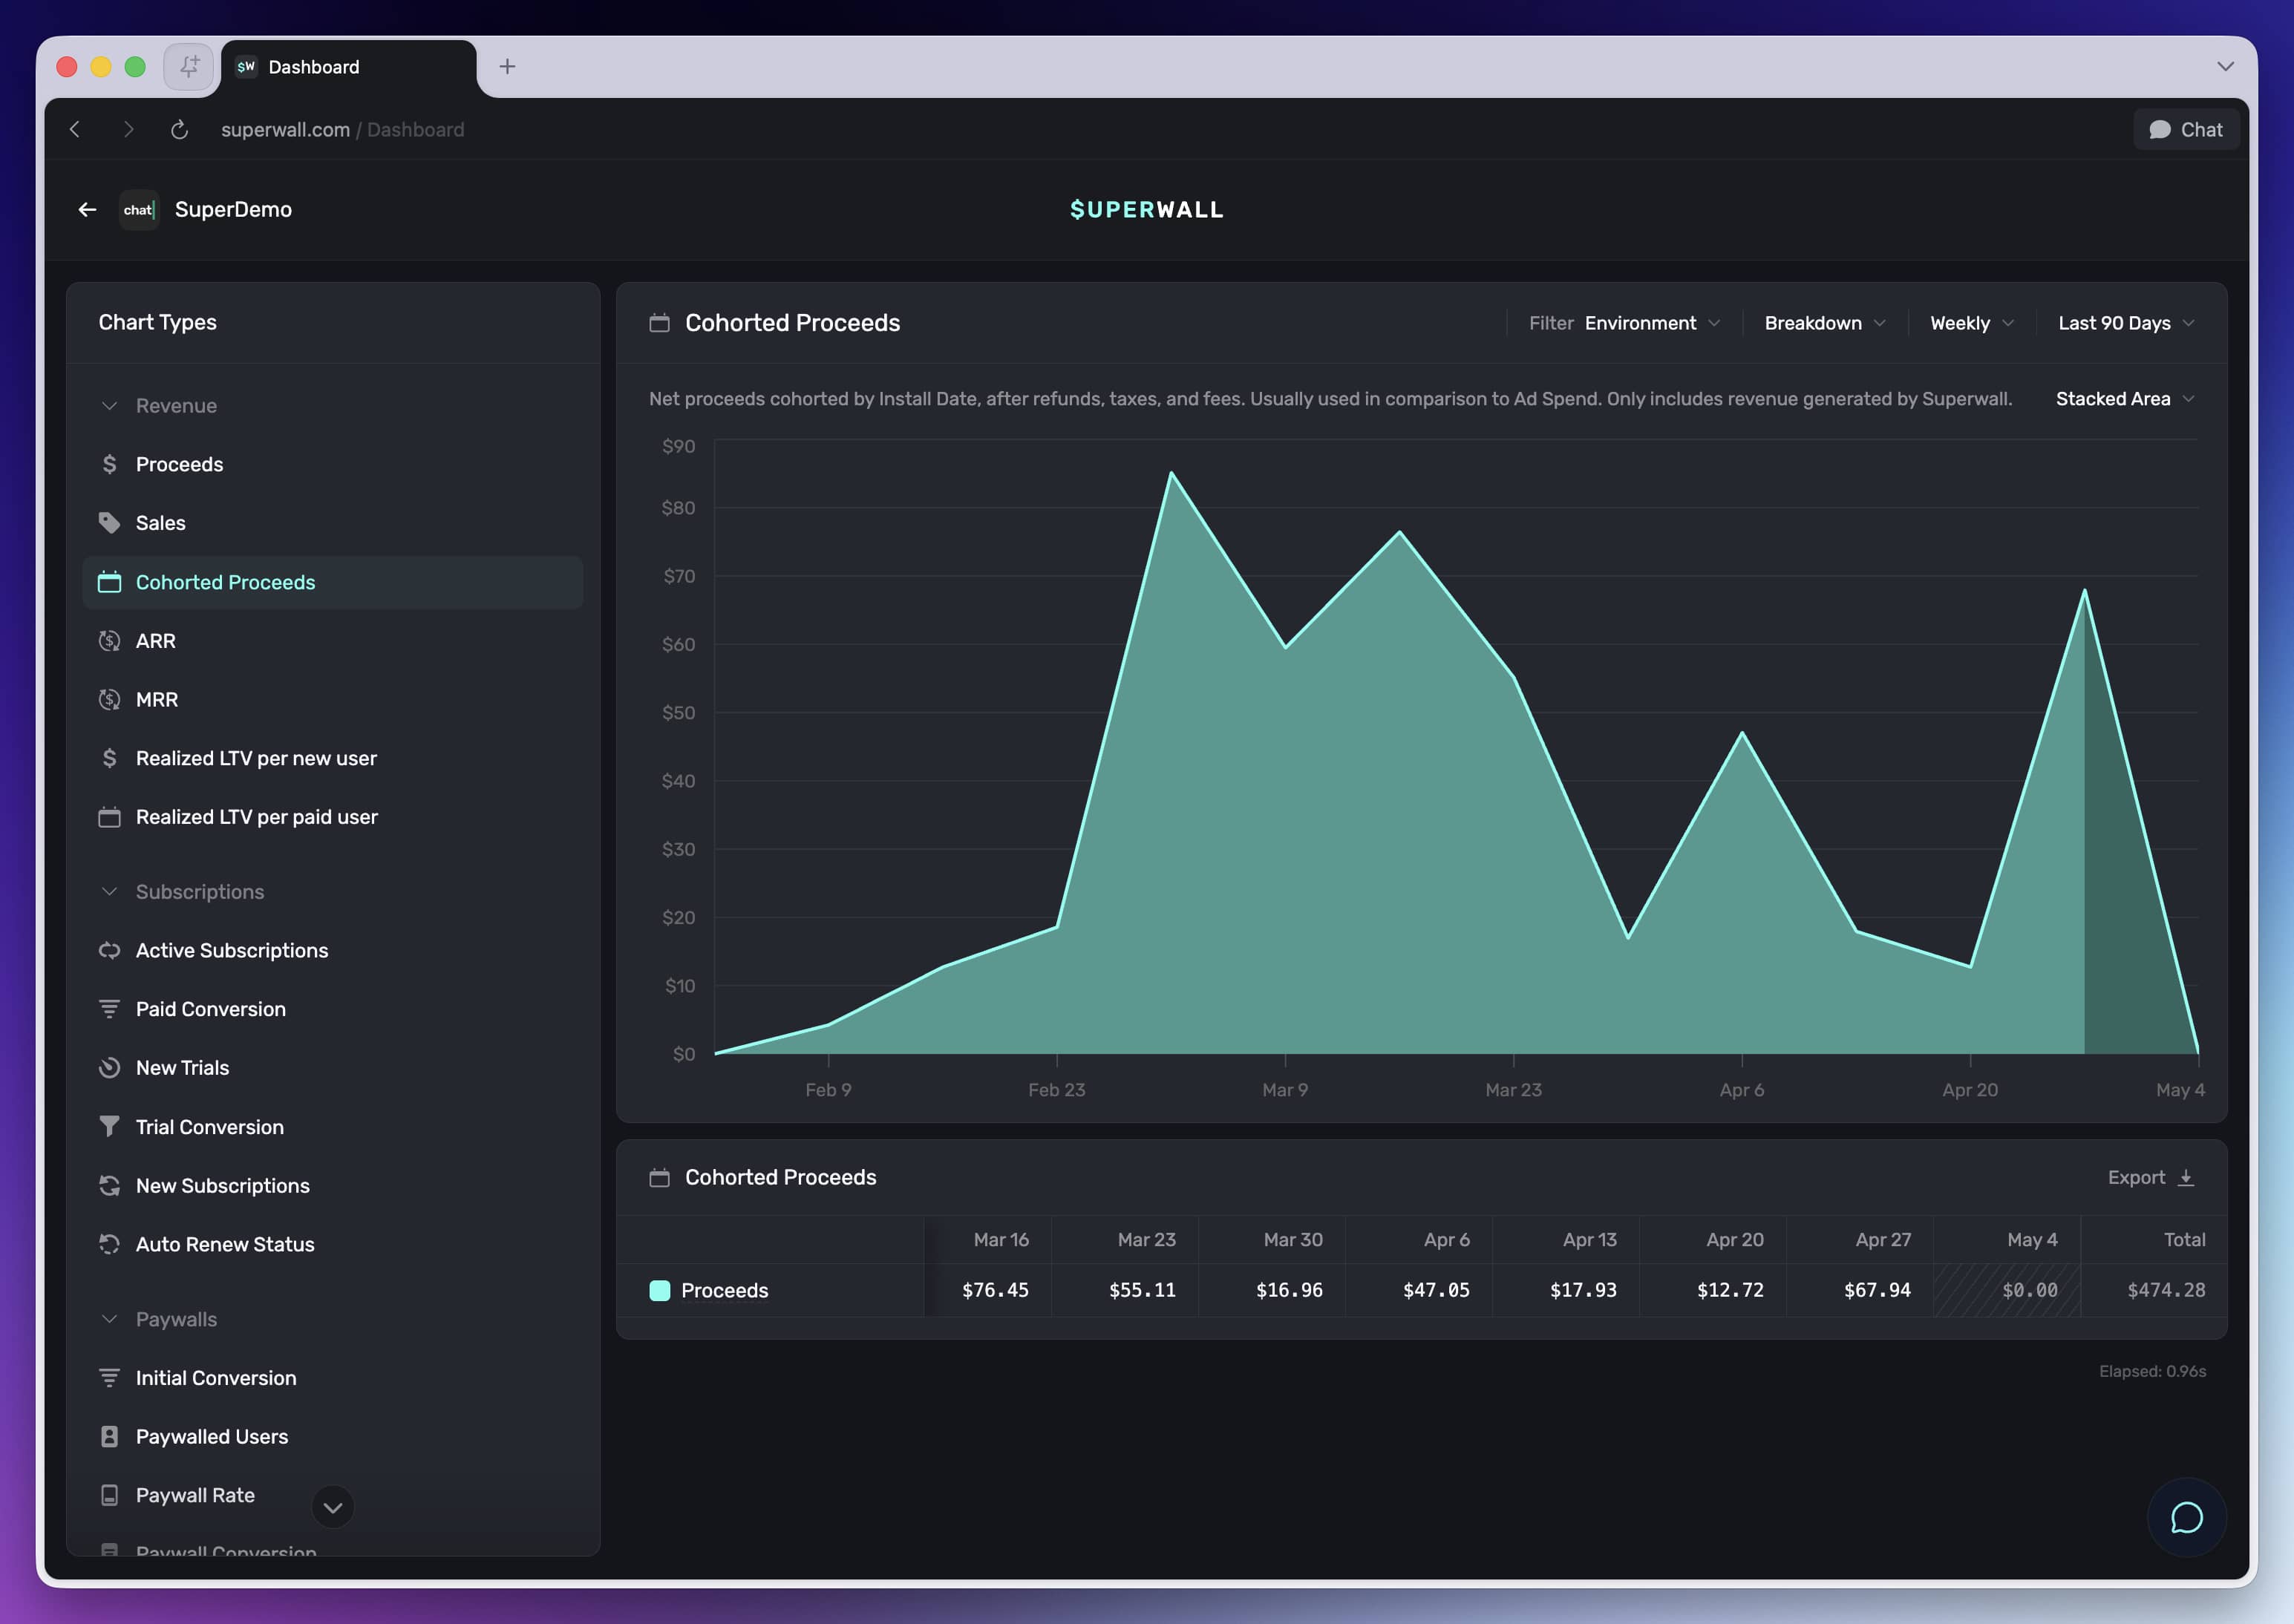
Cohorted Proceeds
Learn what the Cohorted Proceeds chart measures and when to use it.
What it shows
Cohorted Proceeds shows net proceeds grouped by install date. Each cohort represents users who installed during the same period.
How to use it
Use this chart to understand how install cohorts monetize over time. It is a good fit for comparing acquisition quality, measuring payback windows, and reviewing the impact of product or campaign changes by cohort.
Good to know
Pair this chart with acquisition spend when you want to understand whether new cohorts are earning back what you spent to acquire them.
How is this guide?